
More Information
Submitted: March 13, 2025 | Approved: March 19, 2025 | Published: March 20, 2025
How to cite this article: Rosa de Oliveira W, Wust E, Loss JL. Analysis of Torque and Stiffness Parameters in Different Cleat Models: Identification of Key Characteristics Using Regression Models. J Sports Med Ther. 2025; 10(1): 001-015. Available from:
https://dx.doi.org/10.29328/journal.jsmt.1001090
DOI: 10.29328/journal.jsmt.1001090
Copyright License: © 2025 Rosa de Oliveira W, et al. This is an open access article distributed under the Creative Commons Attribution License, which permits unrestricted use, distribution, and reproduction in any medium, provided the original work is properly cited.
Keywords: Soccer; Cleats; Injury and Regression

Analysis of Torque and Stiffness Parameters in Different Cleat Models: Identification of Key Characteristics Using Regression Models
Wagner Rosa de Oliveira1,2*, Eduardo Wust1 and Jeferson Fagundes Loss1
1Department of Physical Education, Physiotherapy and Dance, Federal University of Rio Grande do Sul (UFRGS), Porto Alegre, Brazil
2Department of Biomechanical, Grupo Dass S.A, Ivoti, Brazil
*Address for Correspondence: Wagner Rosa de Oliveira, Department of Physical Education, Physiotherapy and Dance, Federal University of Rio Grande do Sul (UFRGS), Porto Alegre, Albino Hugo Muller, 1200, ap 403, Cidade Nova - CEP: 93900-000- Ivoti, Brazil, Email: [email protected]
This study investigated the relationship between the physical characteristics of soccer cleats and their rotational resistance, aiming to identify the factors that influence maximum torque, stiffness, and the work required for rotation. Fifty-eight cleat models were analyzed, covering different classifications (FirmGround, HardGround, SoftGround, Turf). Tests were conducted in a controlled laboratory setting, utilizing X-ray fluorescence spectroscopy for material analysis, and a rigidimeter for longitudinal stiffness, and a 3D scanner for stud characterization. Rotational resistance was measured with a specific device that simulated the axial load applied to the foot and allowed for the determination of torque values. The results of the ANOVA indicated that cleat classification significantly influenced maximum torque, with SG cleats showing higher values and TF cleats showing lower values. However, stud design did not show a significant effect on torque. Multiple linear regression revealed that stud diameter, stiffness, and material type were significant predictors of maximum torque. Stratified analysis by stud type indicated that for circular cleats, material and stud diameter were the primary determinants of torque, while for pyramid-shaped cleats, the total number of studs had the greatest impact. Regarding stiffness, the overall model explained 41.2% of the variability, with material and stud contact area being the main predictors. Stratification by design revealed that circular cleats had higher stiffness when classified as HG. It is concluded that cleat classification, material type, and stud diameter are determining factors for maximum torque and stiffness, suggesting that these factors should be considered in the development of sports footwear.
In recent years, there has been an exponential increase in the number of studies on footwear and its influence on human movement [1]. These studies have driven the industry to make modifications to footwear, most of which are focused on performance gains [1,2]. In this context, changes in shoe design have sparked significant debate among federations in various sports, such as athletics, which introduced specific rules to define the characteristics that footwear must have in order to prevent disadvantages among athletes who do not have access to the same technologies [2,3]. Similarly, the American football league implemented a regulation in the early 2000s [4] prohibiting the use of cleats with blade-shaped studs. However, this ban was primarily focused on injury prevention, as there was a significant increase in lower limb injuries at the time, many of which were associated with the use of this type of footwear and its interaction with the playing surface [4,5]. In contrast, in other sports that also use grass surfaces and consequently cleats, such as soccer, no similar movement for regulation has occurred.
Soccer is one of the most widely practiced and commercially influential sports in the world, with over 250 million active players globally. This underscores the importance of optimizing footwear design to enhance performance and reduce the incidence of non-contact injuries, which remain a major concern in elite and amateur levels [6]. This sport has evolved considerably in technical and physical terms, resulting in greater external forces being applied to the athletes’ bodies, which leads to more intense overload on the musculoskeletal system [7]. These overloads have been linked to an increase in so-called non-contact injuries, which are defined as injuries where the athlete does not experience direct impact at the affected site [8]. Examples of non-contact injuries include ankle and knee sprains, which can lead to ligament ruptures, dislocations, and muscle injuries. In sports, this type of injury is predominant in the lower limbs, accounting for 78% of the total, regardless of the sport [8,9]. In soccer, over 50% of injuries are classified as non-contact injuries [10]. According to UEFA [11], an average of eight injuries occur per 1000 hours of play, resulting in about two injuries per player per season in European professional leagues. Furthermore, in the general population, lower limb injuries caused by sports cost an average of 1.6 billion dollars in healthcare, allocated for the recovery of these individuals and their reintegration into activities [12]. Therefore, understanding the mechanisms of injuries and implementing interventions that reduce the risk of these injuries is of utmost importance and urgency.
A common mechanism associated with this type of injury involves high loads generated during rotational movements, in which body weight is almost entirely distributed over one limb while the rest of the body changes direction, moving opposite to the initial movement [13]. In these cases, the interaction between the cleat and the ground is the main factor providing stability during movement execution, and it is also a potential agent for preventing excessive external loads [14]. Understanding how cleat design influences rotational resistance is essential for injury prevention. High rotational loads are known to increase the risk of knee and ankle injuries, including anterior cruciate ligament (ACL) tears, which can have long-term consequences for athletes. This study aims to provide critical insights that could inform the development of safer and more effective soccer cleats Thus, understanding the characteristics of cleats, such as stud height, shape, and material type, that can promote stability and protection is crucial. However, modern versions of these sports shoes are much more complex: they feature various materials, increased arch support, shock-absorbing elements, and/or movement control, in addition to performance-enhancing features on the sole. Compared to footwear from other sports, cleats may seem less technical, but they vary significantly in terms of material, stud shape, distribution, sizes, stiffness, and weight [15].
The variety of characteristics in the cleats available on the market creates a wide range of models, which can complicate the choice for both consumers and athletes, as well as lead to a lack of direction for the industry in the development of this type of product. In this regard, the objective of this thesis project is to understand the significant impact of rotational resistance on injury risk, there is still limited understanding of how cleat design and material properties interact to influence torque and stiffness. This study addresses this gap by providing a comprehensive analysis of cleat characteristics, offering valuable information for footwear development and injury prevention strategies, in this regard, and the following objectives will be addressed:
- Characterize the behavior of the main cleats on the market from the perspective of rotational resistance;
- Categorize cleats according to their physical characteristics;
- Analyze soccer cleats in terms of promoting rotational resistance;
- Understand which cleat characteristics are most important for altering rotational resistance;
- Predict rotational resistance based on different physical characteristics of cleats, such as dimensions, shape, and material.
With based of this aims, our hypotheses are:
H₁: Soccer cleats exhibit significant variations in rotational resistance based on their physical characteristics, including stud height, shape, material, and distribution.
H₂: Cleats with specific design features (e.g., increased stud height, specific stud shapes, or materials) are more likely to promote stability and reduce excessive external loads during rotational movements.
H₃: Differences in cleat design contribute to variations in rotational resistance, with specific configurations and material choices influencing the ability to promote stability and reduce excessive loads..
H₄: Rotational resistance of soccer cleats can be predicted based on measurable physical characteristics, including stud configuration, material composition, and stiffness, which are key determinants of rotational behavior.
H₅: The lack of standardized regulations for cleat design in soccer leads to a wide range of models with varying levels of rotational resistance, which may impact injury risk and performance.
The testing protocol was designed to ensure a comprehensive evaluation of the physical and mechanical properties of soccer cleats, following strict standards to ensure data accuracy and reproducibility.
Fifty-eight cleat models from different brands and types available on the market were selected, covering various categories of materials (FG - Firm Ground; HG - Hard Ground; SG - Soft Ground; TF - Turf) and stud designs (Supplementary 1).
All cleats were carefully characterized, including identification of material type, geometric analysis of the studs (number, height, diameter), longitudinal stiffness, and material hardness.
Characterization
For the physical measurements of the footwear, all tests were performed in triplicate, meaning each cleat was tested three times to ensure the reproducibility of the results. The laboratory where the measurements were conducted had a controlled environment (temperature of 22 °C ± 1 °C and relative humidity of 50% ± 5%) to avoid the influence of external factors on the material.
All assessments were conducted by biomechanics specialists with relevant expertise , with academic training and practical experience in the field. Specifically, the tests were performed by a researcher with a PhD in biomechanics and extensive experience in sports footwear testing, as well as specific training in the use of the described equipment.
Determination of material type
To identify the composition of the outsoles, an X-ray fluorescence spectrometer (ARL QUANT’X EDXRF model, Thermo Fisher Scientific) was used. This equipment allows precise identification of the percentage composition of the predominant raw material in the outsoles (Figure 1). The procedure involved positioning the outsole directly in the spectrometer, ensuring that measurements were taken from various areas of the outsole to avoid local variations. This precaution minimized errors associated with material heterogeneity, ensuring data accuracy.
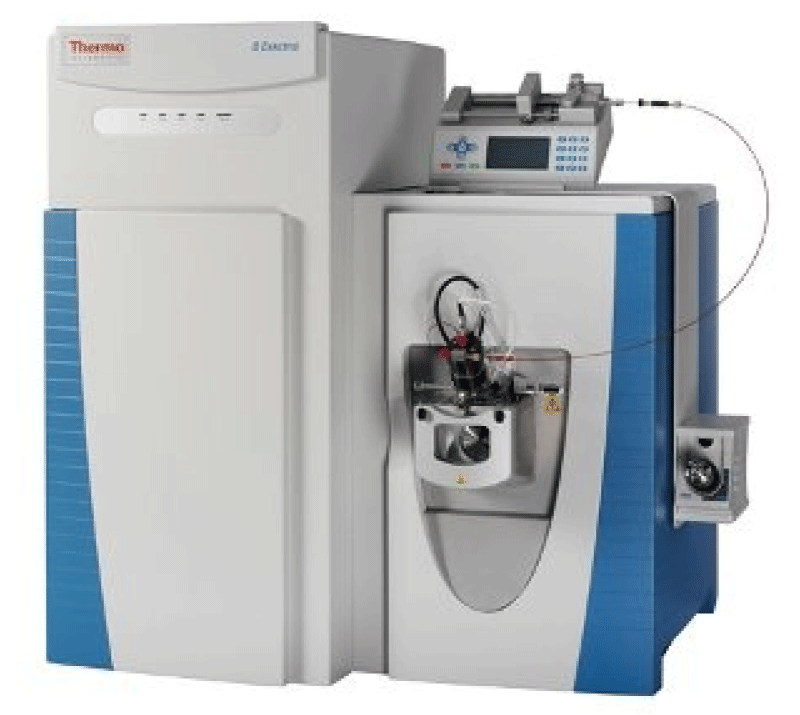
Figure 1: Spectrometer
The determination of longitudinal stiffness was performed utilizing a customized rigidimeter, following the guidelines of ASTM F2333-04 (Standard Test Method for Shoe Bending Stiffness). The rigidimeter (Figure 2) was pre-calibrated to ensure that the applied force was constant and linear throughout the flexion range. The equipment has a load cell attached to the bottom of the platform that bends the shoe. The shoe is positioned on a platform and fixed at the corresponding part of the forefoot. Once activated, the equipment raises the platform at a constant speed, flexing the shoe to an angle of 55º. At the end, the force required to bend the shoe is recorded, as shown on the digital display. The rigidimeter was calibrated before each measurement series to ensure the accuracy of the applied force.
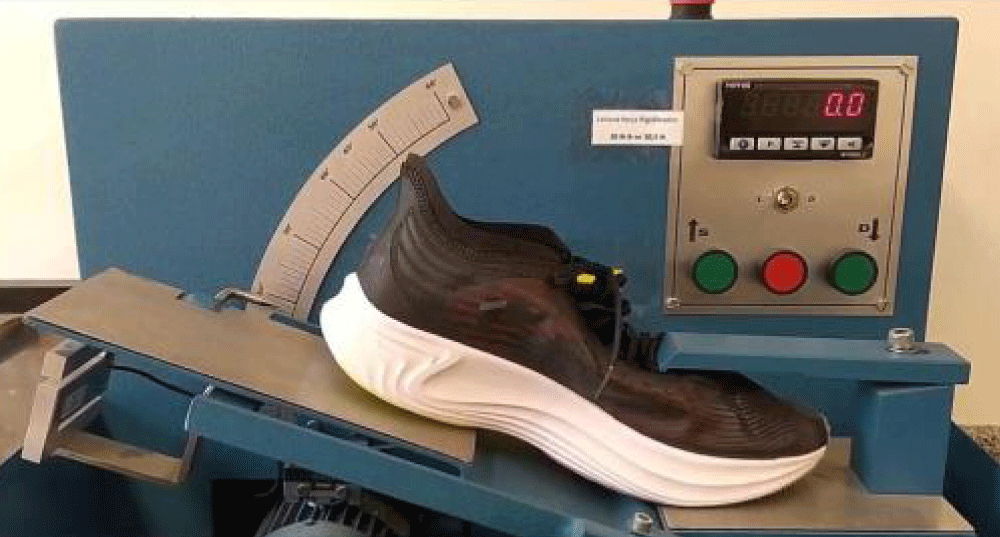
Figure 2: Equipment for determining the longitudinal stiffness of footwear.
The hardness of the outsole was measured utilizing a Shore D durometer, as recommended by ASTM D2240 (Standard Test Method for Rubber Property—Durometer Hardness). The durometer (model HB-3000, Mitutoyo) was equipped with a needle suitable for measuring materials of medium to high hardness, such as the polymers used in the cleats (Figure 3). For each cleat, the outsole was cut into three representative parts (forefoot, midfoot, and heel), ensuring that measurements were taken from different areas of the shoe. The pressure applied during the measurement was standardized, and the contact with the material was made smoothly and evenly, as specified by ASTM D2240.
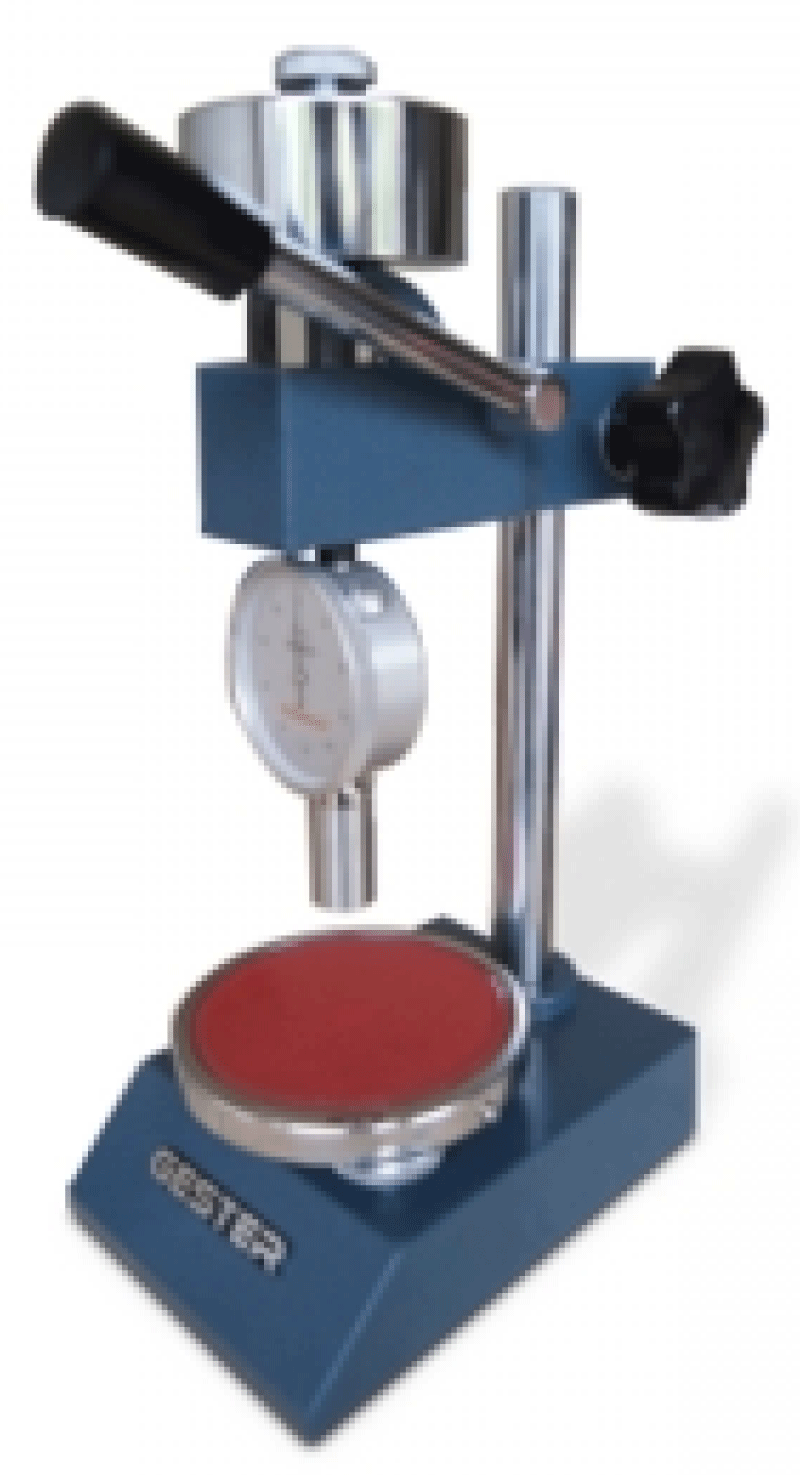
Figure 3: Equipment for material hardness determination.
For the geometric analysis of the studs, the cleats were scanned using a Handy Scan3D 3D scanner (Creaform), which generates a detailed three-dimensional digital model (Figure 4).
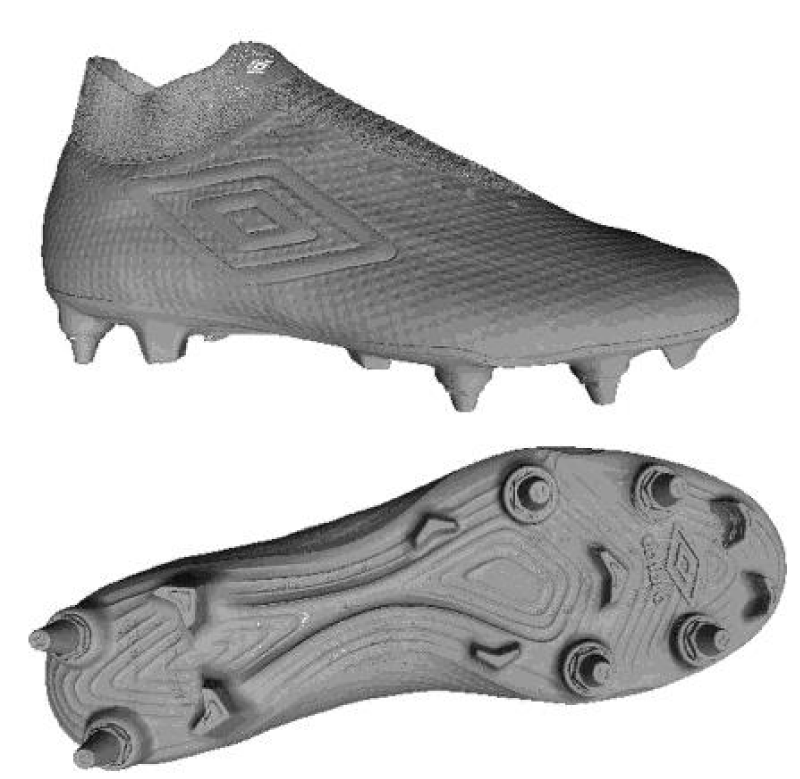
Figure 4: An example of a soccer shoe that was scanned with a 3D scanner.
The height, diameter, and area measurements of the studs were extracted using Rhinoceros® 3D software (version 7.0, Robert McNeel & Associates). In this CAD software, an algorithm was programmed to allow the automatic extraction of the stud dimensions, using the following steps:
Scanning: Each cleat was positioned on the 3D scanner, and reference points for the studs were added to facilitate the capture.
CAD analysis: The automatic area identification algorithm in Rhinoceros® was used to measure the height and diameter of each stud.
Calculation of the proportional stud area: The area was calculated based on the number of studs and their diameters, using the equation:
Proportional stud area = total area / (Number of studs * Stud diameter)
To measure the rotational characteristic of the cleat, an equipment [16] was used, whose psychometric characteristics (repeatability and reproducibility) were properly evaluated (Figure 5). This equipment operates based on the following principle: a load is applied to the central axis (to simulate the axial force applied to the supporting foot), and a traction force is applied to the base disc. A lever is activated to un-cleat the base disc, resulting in relative movement between the shoe and the contact surface.
The force measurement is obtained through a load cell positioned on the axis of the equipment, and the torque, which is the primary measurement that characterizes rotational resistance, is determined by the distance between the load cell and the axis of rotation, which is fixed at 0.05 m (Figure 5).
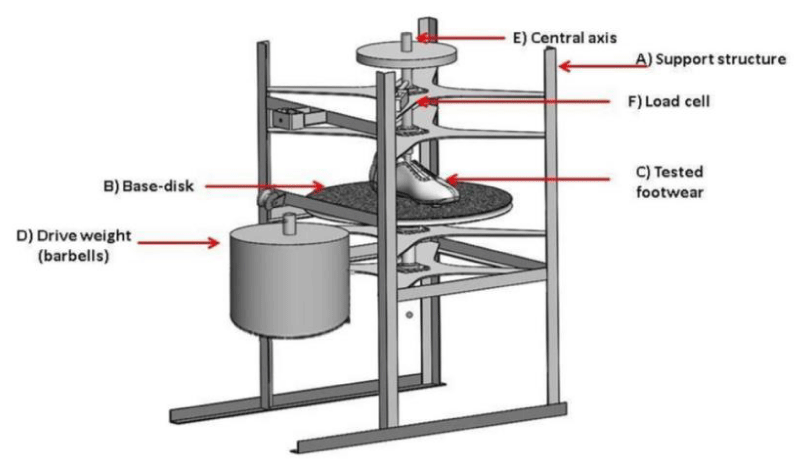
Figure 5: Overview of the assembled equipment and its main characteristics for operation.
To characterize the rotational resistance, the measurements of maximum torque, stiffness, and work were used, extracted from specific points of the torque curve (Figure 6). For maximum torque, the highest torque value was considered, regardless of the region of the curve where the peak torque occurred. Stiffness is calculated from the section between 10 and 30 degrees of rotation, and work is considered as the area under the curve from 0 to 90 degrees of rotation. All data collection and analyses were performed using the BTS Smart Tracker and Smart Analyzer software.
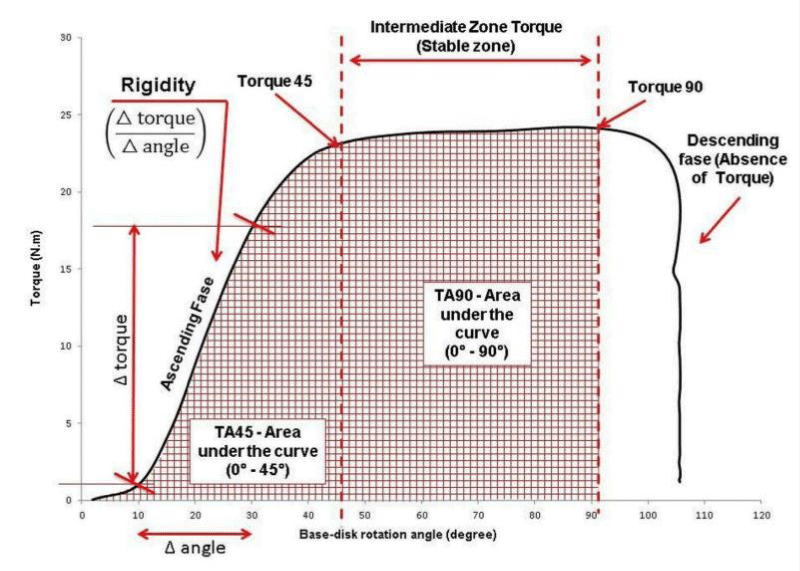
Figure 6: Typical torque curve and moments and measurements extracted from the curve.
The raw data generated from the torque and rotational resistance measurements were processed in the Smart Analyzer software (BTS Bioengineering). The processing included the application of a smoothing filter to eliminate noise, data import, generation of the torque curve, and extraction of the maximum torque, stiffness between 10 and 30 degrees, and the area under the curve. It is worth noting that each test was performed 5 times, and the results presented for each cleat refer to the average of the 5 repetitions.
Statistical analysis
The statistical analysis was performed using IBM SPSS Statistics software (version 27), with multiple linear regression applied to explore the relationships between independent variables and dependent variables related to the properties of the cleats, such as maximum torque, stiffness, and work at 90°.
Before performing the regression analyses, it was necessary to check the adequacy of the data for the linear regression model. The following preliminary steps were followed:
Verification of data normality through the Shapiro-Wilk test, with the null hypothesis being that the data is normally distributed (p > 0.05). Graphical analyses were also performed to determine the prerequisites for regression, using histograms, probability plots (P-P plots), and Q-Q plots. In addition to normality, multicollinearity was assessed using the Variance Inflation Factor (VIF), where VIF values > 10 indicate high multicollinearity. Homoscedasticity: The assumption of constant residual variance was checked through the analysis of standardized residuals against predicted Z values. Finally, Independence of errors was checked using the Durbin-Watson test, which measures the correlation between residuals, with values close to 2 indicating the absence of autocorrelation.
Before the linear regression, a series of Analysis of Variance (ANOVA) tests were conducted to examine the influence of the cleat characteristics (shoe classification, material type, and stud design) on the scalar variables of maximum torque, stiffness, and work at 90°.
ANOVA 1 - Cleat classification (FG, HG, SG, TF) X on maximum torque, stiffness, work at 90°, and average torque.
ANOVA 2 - Material type (Flexible, Rigid) X on maximum torque, stiffness, and work at 90°.
ANOVA 3 - Stud design type (circular, pyramidal, mixed) X on maximum torque, stiffness, and work at 90°.
Each ANOVA was followed by a Bonferroni post hoc test to identify where significant differences occurred between the groups. The significance level adopted for all analyses was α = 0.05.
Multiple linear regression was used to examine how the independent variables affect the dependent variables (maximum torque, stiffness, and work at 90°). The following models were considered:
Model 1: Considering all independent variables
In the first step, a multiple regression was performed, considering all independent variables, including discrete variables (stud diameter, stud height, number of studs, hardness, and stiffness) and nominal variables (classification, design type, material).
To include nominal variables in the model, the “Dummy” variable technique was used to convert categorical variables into binary numerical variables (0 or 1), allowing them to be included in the regression model [17]. The categorical variables were transformed as follows: Cleat classification: Dummy variables were created to represent each classification category (FG, HG, SG, TF), with the TF category as the reference group. Stud design type: The design categories (circular, pyramidal, mixed) were coded into Dummy variables, with the pyramidal design as the reference group. Material type: The material type was also treated as a Dummy variable, with the flexible material as the reference group.
For these models, the forced entry method was used, where all independent variables are entered into the model at once, without automatic selection. The use of this method is justified by the need to test the influence of each variable on cleat performance, regardless of the initial predictive power of each variable. This method ensures that the impact of each variable is evaluated hierarchically and according to its theoretical assumption. The regression model was applied for each dependent variable separately: Maximum Torque, Stiffness, Work at 90°
Model 2: Stratification by stud design type
In the second step of the analysis, the data were stratified according to the stud design type (circular, pyramidal, mixed), allowing for the identification of how the relationships between independent and dependent variables vary based on stud design.
For each design group, a new multiple regression was performed, again utilizing the forced entry method, to ensure that all independent variables were included. The classification and material variables were included as Dummy variables.
Maximum torque value
Analysis of variance: The results of the ANOVA conducted to evaluate the effects of cleat classification types on the maximum torque value indicate a significant effect (F = 7.479; p = 0.001) Table 1. In other words, differences between cleat classifications influence the maximum torque generated. The Bonferroni post-hoc analysis revealed that TF (turf shoes) had a significantly lower torque compared to FG (firm ground) shoes, with an average difference of 10.2 N.m (p = 0.001). Additionally, TF shoes also showed lower torque compared to HG (hard ground) shoes, with an average difference of 8.1 N.m (p = 0.006), and lower torque compared to SG (soft ground) shoes, with an average difference of 9.4 N.m (p = 0.057).
| Table 1: ANOVA effects of cleat classification types on the maximum torque value. | ||||
| Average ± sd | F | p - value | Effect Size eta² | |
| FG | *30,03±6,8 | 7,479 | 0,001 | |
| HG | *28,62±6,4 | |||
| SG | 29,90±11,6 | |||
| TF | 19,72±4,1 | |||
| Legend: *significant difference Bonferroni p < 0,05 TF x FG and TF x HG. | ||||
When the same analysis was performed for stud designs, the ANOVA was not significant, F = 0.229, p = 0.796, meaning that the stud design does not seem to influence the maximum torque value Table 2.
| Table 2: Summary of the multiple linear regression model for the dependent variable Maximum Torque Value. | |||||||
| Summary of the model - Maximum Torque Value | |||||||
| R | R² | Adjusted R² | df1 | df2 | p - value | Durbin-Watson | ANOVA |
| 0,807a | 0,652 | 0,549 | 13 | 44 | 0,001 | 1,885 | 0,01 |
| Legend: a Predictors: (Constant), Dummy_FG, Dummy_HG, Dummy_SG, Dummy_Circular, Dummy_Mista, Dummy_Material, Total Number of Cleats, Total Average Height (mm), Total Average Diameter (mm), Hardness, Stiffness, Total Area (cm²), Force/Area Nm/cm² | |||||||
Multiple linear regression: Considering Model 1 with all independent variables, the multiple linear regression model is statistically significant (p < 0.001), explaining 65.2% of the variation in maximum torque (Table 2). The most important predictors are:
The SG cleat type and the material type, both with significant effects.
- Stud diameter, which has an increasing effect on torque.
- Stiffness, which was inversely associated with maximum torque, indicating that stiffer cleats tend to reduce torque.
The value of R = 0.807 indicates a strong relationship between the predictor variables and the maximum torque. The R² value = 0.652 shows that approximately 65.2% of the variability in maximum torque can be explained by the independent variables. When adjusting the model to the number of variables, the adjusted R² = 0.549, indicating that 54.9% of the variation in maximum torque is explained by the model. The Durbin-Watson test = 1.885 indicates that there is no significant autocorrelation in the residuals, meeting the requirements for multiple linear regression (Table 2). The ANOVA of the model suggests that the set of independent variables has a significant effect on maximum torque. The model is robust, with statistical significance of p < 0.01.
The variable Dummy_SG (Standardized Beta = 0.25, p = 0.023) indicates that the cleat classified as SG (Soft Ground) has a significant effect on maximum torque, with a 69.1% increase compared to the reference category (Table 3). The Dummy_Circular (Standardized Beta = -0.20, p = 0.074) suggests that although the circular stud design was not statistically significant (p = 0.074), there is a strong trend that the circular design may reduce maximum torque by 33.4% (Table 3). For the Dummy_Material (Standardized Beta = 0.56, p = 0.005), the material type of the cleats was also highly significant, increasing maximum torque by 87.4%. The same was true for the variable Average Total Diameter (mm) (Standardized Beta = 0.37, p = 0.004), where the average stud diameter has a positive and significant impact on maximum torque, with a 4.6% increase for every 1 mm increase in diameter. Rigidity (Standardized Beta = -0.40, p = 0.035) shows that cleat rigidity was a significant predictor and inversely related to maximum torque. Each 1 N increase in rigidity results in a 2.7% decrease in maximum torque, contrary to expectations. The other coefficients, such as Total Number of Studs, Average Total Height, and Hardness, were not statistically significant, suggesting that these variables may not significantly influence maximum torque in the model.
| Table 3: Multiple linear regression coefficient for the dependent variable Maximum Torque Value, model 1, considering all variables. | |||||||||
| B | Standard Error | Standardized Beta | t | p -Value | Lower Limit | Upper Limit | Tolerance | VIF | |
| (Constant) | 10,28 | 10,08 | 1,02 | 0,31 | -10,03 | 30,59 | |||
| Dummy_FG | 0,37 | 3,04 | 0,02 | 0,12 | 0,90 | -5,76 | 6,50 | 0,25 | 4,02 |
| Dummy_HG | -2,95 | 3,11 | -0,17 | -0,95 | 0,35 | -9,22 | 3,33 | 0,24 | 4,21 |
| Dummy_SG | 7,10 | 3,01 | 0,25 | 2,36 | 0,02* | 1,04 | 13,15 | 0,69 | 1,45 |
| Dummy_Circular | -3,44 | 1,88 | -0,20 | -1,83 | 0,07* | -7,23 | 0,35 | 0,65 | 1,54 |
| Dummy_Mixed | 2,85 | 2,13 | 0,15 | 1,33 | 0,19 | -1,45 | 7,14 | 0,59 | 1,69 |
| Dummy_Material | 8,99 | 3,02 | 0,56 | 2,98 | 0,01* | 2,90 | 15,08 | 0,23 | 4,44 |
| Total Number of Cleats | 0,04 | 0,08 | 0,14 | 0,47 | 0,64 | -0,12 | 0,19 | 0,10 | 10,41 |
| Total Average Height (mm) | 0,64 | 0,56 | 0,29 | 1,13 | 0,26 | -0,50 | 1,77 | 0,12 | 8,04 |
| Total Average Diameter (mm) | 0,47 | 0,16 | 0,37 | 3,05 | 0,01* | 0,16 | 0,78 | 0,53 | 1,88 |
| Hardness | 0,32 | 0,21 | 0,27 | 1,55 | 0,13 | -0,10 | 0,74 | 0,26 | 3,84 |
| Stiffness | -0,28 | 0,13 | -0,40 | -2,18 | 0,04* | -0,53 | -0,02 | 0,23 | 4,35 |
| Total Area (cm²) | 3,19 | 3,41 | 0,14 | 0,94 | 0,35 | -3,68 | 10,07 | 0,34 | 2,94 |
| Force/Area Nm/cm² | 0,01 | 0,03 | 0,08 | 0,49 | 0,63 | -0,04 | 0,07 | 0,34 | 2,98 |
| p < 0.05, statistically significant difference | |||||||||
Model 2 - Stratified by design type
Circular: Based on the multiple linear regression model for the circular design type, the results indicate a significant explanation for the variation in maximum torque. The model has an R² coefficient of 0.88, with an adjusted R² of 0.746, meaning that 74.6% of the variation in maximum torque can be explained by the included predictor variables. The Durbin-Watson test resulted in 2.65, indicating that there is no high correlation between the residuals. The F statistic (F = 4.15, p = 0.04) demonstrates that the model is statistically significant (Table 4).
| Table 4: Summary of the multiple linear regression model for the dependent variable Maximum Torque Value. | |||||||
| Model Summary | |||||||
| R | R² | Adjusted R² | df1 | df2 | p - value | Durbin-Watson | ANOVA |
| 0,938b | 0,887 | 0,746 | 9 | 8 | 0,007 | 2,65 | 0,04 |
| a DESIGN TYPE = Dummy_Circular b Legend: Predictors: (Constant), Dummy_FG, Dummy_HG, Dummy_SG, Dummy_Material, Total Number of Cleats, Total Average Height (mm), Total Average Diameter (mm), Hardness, Stiffness, Total Area (cm²), Force/Area Nm/cm² |
|||||||
Among the predictors analyzed, Dummy_SG showed a relevant and significant effect according to the model (Standardized Beta = 0.47, t = 1.82, p = 0.02). Indeed, there seems to be a tendency for an increase in maximum torque for this type of shoe (Table 5). The average stud diameter also stood out, with a considerable positive effect (Standardized Beta = 0.51, t = 2.85, p = 0.02), suggesting that an increase in the stud diameter may be associated with an increase in maximum torque. Another important predictor was the material type (Standardized Beta = 0.56, t = 2.42, p = 0.04) (Table 5), indicating that the choice of material seems to significantly influence this model.
| Table 5: Multiple linear regression coefficient for the dependent variable Maximum Torque Value, Model 2, considering all variables. | |||||||||
| Variables | B | Standard Error | Standardized Beta | t | p - value | Lower Limit | Upper Limit | Tolerance | VIF |
| (Constant) | 10,51 | 8,59 | 1,22 | 0,26 | -9,30 | 30,31 | |||
| Dummy_HG | 3,22 | 2,74 | 0,21 | 1,18 | 0,27 | -3,09 | 9,54 | 0,45 | 2,20 |
| Dummy_SG | 14,64 | 5,19 | 0,47 | 2,82 | 0,02* | 2,69 | 26,60 | 0,54 | 1,87 |
| Dummy_Material | 8,11 | 3,34 | 0,56 | 2,42 | 0,04* | 0,40 | 15,82 | 0,29 | 3,51 |
| Total Average Height (mm) | 0,39 | 0,64 | 0,18 | 0,60 | 0,57 | -1,10 | 1,87 | 0,16 | 6,29 |
| Total Average Diameter (mm) | 0,65 | 0,23 | 0,51 | 2,85 | 0,02* | 0,13 | 1,18 | 0,46 | 2,16 |
| Hardness | -0,21 | 0,24 | -0,21 | -0,88 | 0,40 | -0,77 | 0,34 | 0,28 | 3,60 |
| Stiffness | -0,02 | 0,25 | -0,03 | -0,08 | 0,94 | -0,60 | 0,57 | 0,14 | 7,39 |
| Total area (cm²) | 0,02 | 4,14 | 0,00 | 0,01 | 1,00 | -9,52 | 9,57 | 0,28 | 3,52 |
| Force/Area Nm/cm² | 0,02 | 0,03 | 0,19 | 0,71 | 0,50 | -0,05 | 0,09 | 0,21 | 4,68 |
| p < 0.05, statistically significant difference | |||||||||
For other predictors, such as height, rigidity, hardness, area, and force/area ratio, there was no statistical significance, as their associations with maximum torque were very weak.
Thus, the model for circular design cleats points out some interesting effects, such as the impact of the SG shoe type, stud diameter, and material type (soft or flexible).
Pyramidal: For the model considering only the pyramidal shoe, the results demonstrate a strong explanation of the variation in maximum torque. The R² is 0.804, with an adjusted R² of 0.666, indicating that 66.6% of the variation in maximum torque can be explained by the predictor variables included. The Durbin-Watson test showed a value of 1.81, suggesting the absence of autocorrelation between the residuals (Table 6).
| Table 6: Summary of the multiple linear regression model for the dependent variable Maximum Torque Value. | |||||||
| Model summary - Maximum Torque Value | |||||||
| R | R² | Adjusted R² |
df1 | df2 | p - value | Durbin-Watson | ANOVA |
| 0,89 | 0,80 | 0,66 | 10 | 15 | 0,01 | 1,81 | 0,01 |
| Legend: a Predictors: (Constant), Dummy_FG, Dummy_SG, Dummy_Material, Total Number of Cleats, Total Average Height (mm), Total Average Diameter (mm), Hardness, Stiffness, Total Area (cm²), Force/Area Nm/cm² | |||||||
The model is statistically significant (F = 5.985, p = 0.01).
Among the most relevant predictors, the Total Number of Studs stands out with a standardized Beta value of 1.0, a p-value of 0.02, and a high VIF value of 12.71 for Total Number of Studs, suggesting high multicollinearity. However, this is an important predictor for the model, so when excluded, it drastically influences the values. Thus, we evaluated it as positive to keep it in the analysis. The determination of classification (whether the shoe is FG, SG compared to TF) also showed relevance, with FG (standardized Beta = 0.528, p = 0.02) and SG (standardized Beta = 0.505, p = 0.01). Another variable that showed significant relevance in the model was Rigidity and Material, with standardized Betas of -0.980, p = 0.01 and 0.708, p = 0.001, respectively. This indicates that the type of material, flexible or rigid, plays a significant role in increasing or decreasing the maximum torque for the pyramidal shoe. Another important predictor was the average diameter of the studs (standardized Beta = 0.54, p = 0.01), suggesting that as the diameter of the studs increases, the torque also increases significantly. The average height of the studs also had a relevant effect (standardized Beta = 0.780, p = 0.06), though it was above the significance level. For the remaining variables: Hardness (standardized Beta = 0.220, p = 0.410), Total Area (cm²) (standardized Beta = 0.230, p = 0.446), and Force/Area (Nm/cm) (standardized Beta = 0.08, p = 0.732) did not present statistically significant effects, suggesting a lower influence on the maximum torque. Thus, for pyramidal/rectangular shoes, the model shows that the most important characteristics for altering the maximum torque are the number of studs, material, rigidity, height, diameter of the studs, and hardness (Table 7).
| Table 7: Multiple Linear Regression Coefficient for the Dependent Variable Maximum Torque Value, Model 2. | |||||||||
| Variables | B | Standard Error | Standardized Beta | t | p -Value | Lower Limit | Upper Limit | Tolerance | VIF |
| (Constant) | -12,06 | 21,89 | -0,55 | 0,59 | -58,71 | 34,59 | |||
| Dummy_FG | 9,96 | 4,13 | 0,53 | 2,41 | 0,03* | 1,17 | 18,76 | 0,28 | 3,58 |
| Dummy_SG | 21,97 | 7,01 | 0,51 | 3,14 | 0,01* | 7,04 | 36,91 | 0,52 | 1,94 |
| Dummy_Material | 13,36 | 4,89 | 0,79 | 2,73 | 0,02* | 2,93 | 23,78 | 0,16 | 6,24 |
| Total Number of Cleats | 0,36 | 0,14 | 1,07 | 2,59 | 0,02* | 0,06 | 0,66 | 0,08 | 12,75 |
| Total Average Height (mm) | 1,89 | 0,93 | 0,78 | 2,04 | 0,06 | -0,09 | 3,86 | 0,09 | 10,96 |
| Total Average diameter (mm) | 0,89 | 0,31 | 0,54 | 2,85 | 0,01* | 0,23 | 1,56 | 0,37 | 2,71 |
| Hardness | 0,30 | 0,35 | 0,22 | 0,85 | 0,41 | -0,45 | 1,05 | 0,20 | 5,04 |
| Stiffness | -0,68 | 0,19 | -0,98 | -3,51 | 0,01* | -1,10 | -0,27 | 0,17 | 5,82 |
| Total area (cm²) | 6,16 | 7,86 | 0,23 | 0,78 | 0,45 | -10,60 | 22,92 | 0,16 | 6,43 |
| Force/Area Nm/cm² | 0,04 | 0,11 | 0,08 | 0,35 | 0,73 | -0,19 | 0,26 | 0,23 | 4,38 |
| p < 0.05, statistically significant difference | |||||||||
Mixed design: For the mixed design type, the results indicate a good explanatory power of the model. The R² value is 0.928, while the adjusted R² drops to 0.743, suggesting that 74% of the variation in maximum torque can be explained by the predictor variables. The Durbin-Watson test showed a value of 2.03, indicating no issues with autocorrelation of the residuals. The overall model showed a statistically significant difference (F = 7.279, p = 0.01), suggesting that the set of predictors can significantly explain the maximum torque in the context of mixed design football boots (Table 8).
| Table 8: Summary of the multiple linear regression model for the dependent variable Maximum Torque Value. | |||||||
| Model summary - Maximum Torque Value | |||||||
| R | R² | Adjusted R² | df1 | df2 | p - value | Durbin-Watson | ANOVA |
| 0,928 | 0,862 | 0,743 | 6 | 7 | 0,01 | 2,03 | 0,01 |
| Legend: a Predictors: (Constant), Dummy_FG, Dummy_HG, Average Total Height (mm), Average Total Diameter (mm), Hardness, Stiffness, total_area (cm²) | |||||||
It is interesting to note the high coefficients for the variables Hardness and Average Diameter, with standardized Beta values of 1.67 (p = 0.01) and 0.86 (p = 0.04), respectively. This suggests a potential reduction in maximum torque for mixed design boots when using harder materials and larger diameter studs. For the other measures, Average Total Height, Total Area (cm²), Dummy_FG, and Dummy_HG, no statistically significant differences were found. Therefore, the model shows that for boots with mixed stud designs, the characteristics of stud diameter and hardness are more relevant (Table 9).
| Table 9: Coefficients of the multiple linear regression for the dependent variable Maximum Torque Value, Model 2, for mixed design boots. | |||||||||
| Variables | B | Standard Error | Standardized Beta | t | p -Value | Lower Limit | Upper Limit | Tolerance | VIF |
| (Constant) | -18,43 | 9,27 | -1,99 | 0,09 | -40,35 | 3,50 | |||
| Dummy_FG | -8,78 | 5,79 | -0,56 | -1,52 | 0,17 | -22,47 | 4,91 | 0,15 | 6,89 |
| Dummy_HG | -2,31 | 5,39 | -0,10 | -0,43 | 0,68 | -15,06 | 10,43 | 0,34 | 2,99 |
| Total Average Height (mm) | -1,00 | 1,08 | -0,47 | -0,92 | 0,39 | -3,56 | 1,57 | 0,08 | 13,22 |
| Total Average Diameter (mm) | 0,89 | 0,35 | 0,86 | 2,54 | 0,04* | 0,06 | 1,72 | 0,17 | 5,78 |
| Hardness | 1,89 | 0,51 | 1,65 | 3,70 | 0,01* | 0,68 | 3,10 | 0,10 | 10,07 |
| Total area (cm²) | -10,65 | 7,13 | -0,49 | -1,49 | 0,18 | -27,52 | 6,22 | 0,18 | 5,55 |
| p < 0.05, statistically significant difference | |||||||||
Mixed design: For the mixed design type, the results indicate a good explanatory power of the model. The R² value is 0.928, while the adjusted R² drops to 0.743, suggesting that 74% of the variation in maximum torque can be explained by the predictor variables. The Durbin-Watson test showed a value of 2.03, indicating no issues with autocorrelation of the residuals. The overall model showed a statistically significant difference (F = 7.279, p = 0.01), suggesting that the set of predictors can significantly explain the maximum torque in the context of mixed design football boots (Table 8).
Stiffness
Multiple linear regression for all measurements: The table below presents the data for the stiffness variable, considering model 1 with all independent variables assigned to the model, without stratifying by classification, design, or material. The multiple linear regression model is statistically significant (p = 0.005), explaining with an R² of 0.412, meaning it explains 41.2% of the variation in stiffness (Table 10). The Durbin-Watson test shows a low value of 2.00, meeting the requirements for regression. Among the independent variables in the model, the following stand out:
| Table 10: Summary of the multiple linear regression model for the dependent variable Stiffness, model considering all independent variables | |||||||
| Model summary - stiffness value | |||||||
| R | R² | AdjustedR² | df1 | df2 | Sig. F Alteration | Durbin-Watson | ANOVA |
| 0,642 | 0,412 | 0,271 | 11 | 46 | 0,.005 | 2,00 | 0,005 |
Contact Area/Number of Cleats (cm²) - This variable showed the most significant effect with p = 0.01, although it had a relatively high VIF of 11.33. However, considering the significance of this measure for the model, this variable was not excluded as it plays an important role in the results. Another variable that showed significant representativeness was Dummy_Material, with a p-value of 0.03. The same occurred for Dummy_Mixed, which was statistically significant, explaining part of the variation in stiffness in the model with p = 0.05 (Table 11).
| Table 11: Multiple linear regression coefficient for the dependent variable Stiffness, model considering all independent measures. | |||||||||
| B | Standard Error | Standardized Beta | t | p -Value | Lower Limit | Upper Limit | Tolerance | VIF | |
| (Constant) | 0,09 | 0,34 | 0,27 | 0,79 | -0,59 | 0,76 | |||
| Dummy_FG | 0,15 | 0,15 | 0,26 | 1,04 | 0,30 | -0,14 | 0,45 | 0,21 | 4,89 |
| Dummy_HG | 0,21 | 0,16 | 0,36 | 1,37 | 0,18 | -0,10 | 0,53 | 0,19 | 5,40 |
| Dummy_SG | 0,24 | 0,13 | 0,25 | 1,83 | 0,07 | -0,03 | 0,50 | 0,71 | 1,41 |
| Dummy_Circular | -0,06 | 0,08 | -0,11 | -0,76 | 0,45 | -0,23 | 0,10 | 0,66 | 1,52 |
| Dummy_Mixed | 0,18 | 0,09 | 0,28 | 2,03 | 0,05 | 0,00 | 0,36 | 0,68 | 1,48 |
| Dummy_Material | 0,28 | 0,12 | 0,50 | 2,32 | 0,03 | 0,04 | 0,52 | 0,28 | 3,62 |
| Total Average Diameter (mm) | 0,01 | 0,01 | 0,26 | 1,66 | 0,10 | 0,00 | 0,03 | 0,54 | 1,85 |
| Hardness | 0,02 | 0,01 | 0,38 | 1,75 | 0,09 | 0,00 | 0,03 | 0,27 | 3,70 |
| Stiffness | 0,00 | 0,01 | -0,10 | -0,38 | 0,71 | -0,02 | 0,01 | 0,19 | 5,16 |
| Contact Area/Number of Cleats (cm²) | -0,03 | 0,02 | -0,65 | -1,72 | 0,01 | -0,06 | 0,01 | 0,09 | 11,33 |
| Force/Area Nm/cm² | -0,01 | 0,00 | -0,01 | -0,09 | 0,93 | 0,00 | 0,00 | 0,56 | 1,80 |
Stratified by type of design
Circular: Based on the multiple linear regression model, when stratified by design type, the only model that was statistically significant was the circular design. For the others, there was no statistical difference, which may be explained by the sample size, or even by the characteristics evaluated, which did not have a significant impact for the other types of cleat designs evaluated. The model for the circular cleat design was able to explain the variation in stiffness, with an R² coefficient of 0.660 and an Adjusted R² of 0.420, meaning that 42% of the variation in stiffness can be explained by the model. The Durbin-Watson test showed an autocorrelation value of 2.45, and the test was statistically significant (p = 0.05) (Table 12).
| Table 12: Summary of the multiple linear regression model for the dependent variable Stiffness, model considering stratification by design, Circular cleat. | ||||||||
| Model Summary - Stiffness value | ||||||||
| Model | R | R² | AdjustedR² | df1 | df2 | Sig. F Alteration | Durbin-Watson | ANOVA |
| 1 | 0,813 | 0,660 | 0,423 | 7 | 10 | 0,04 | 2,45 | 0,04 |
Among the predictors analyzed, the only one that was statistically significant was the Dummy_HG variable, according to the model (Standardized Beta = 0.47, t = 2.24, p = 0.04). In fact, there seems to be a trend for an increase in stiffness for this type of cleat (Table 6). Other predictors were not statistically significant, but it is worth mentioning Dummy_FG and Force/Area Nm/cm², with Standardized Beta = 0.61 (p = 0.17) and Standardized Beta = 0.59 (p = 0.13), respectively (Table 13).
| Table 13: Coefficient of multiple linear regression for the dependent variable Stiffness, model considering stratification by design, Circular cleat. | |||||||||
| B | Standard Error | Standardized Beta | t | p -Value | Lower Limit | Upper Limit | Tolerance | VIF | |
| (Constant) | -0,23 | 0,33 | -0,69 | 0,50 | -0,96 | 0,50 | |||
| Dummy_FG | 0,30 | 0,21 | 0,61 | 1,46 | 0,17 | -0,16 | 0,76 | 0,20 | 5,03 |
| Dummy_HG | 0,41 | 0,18 | 0,87 | 2,24 | 0,04 | 0,00 | 0,82 | 0,22 | 4,46 |
| Dummy_SG | 0,47 | 0,26 | 0,48 | 1,82 | 0,10 | -0,11 | 1,04 | 0,49 | 2,06 |
| Material | 0,25 | 0,16 | 0,55 | 1,60 | 0,14 | -0,10 | 0,60 | 0,29 | 3,49 |
| Total Average Diameter (mm) | 0,01 | 0,01 | 0,24 | 0,80 | 0,44 | -0,02 | 0,04 | 0,40 | 2,51 |
| Hardness | -0,01 | 0,01 | -0,23 | -0,80 | 0,44 | -0,03 | 0,01 | 0,41 | 2,43 |
| Force/Area Nm/cm² | 0,00 | 0,00 | 0,59 | 1,67 | 0,13 | 0,00 | 0,01 | 0,28 | 3,62 |
Stratified by classification: For the classification type, although there were no statistically significant differences for the maximum torque value, a good model for stiffness was identified, which could well represent the variations in the stiffness variable considering its predictors (Table 14).
| Table 14: Summary of the multiple linear regression model for the dependent variable Stiffness, model considering stratification by classification. | ||||||||
| Model summary - stiffness value | ||||||||
| Model | R | R² | Adjusted R² | df1 | df2 | Sig. F Alteration | Durbin-Watson | ANOVA |
| 1 | 0,902 | 0,814 | 0,670 | 7 | 9 | 0,01 | 2,26 | 0,01 |
Among the classifications, the models that showed statistically significant differences were FG and TF. For the HG classification, no differences were found, as the behavior for this type of cleat was extremely variable, and SG did not have a sufficient sample size to be considered in the analysis (Table 15).
| Table 15: Coefficient of multiple linear regression for the dependent variable Stiffness, model considering stratification by classification. | |||||||||
| B | Standard Error | Standardized Beta | t | p -value | Lower Limit | Upper Limit | Tolerance | VIF | |
| (Constant) | -4,18 | 0,84 | -5,00 | 0,00 | -6,08 | -2,29 | |||
| Dummy_Circular | -0,23 | 0,14 | -0,37 | -1,65 | 0,13 | -0,56 | 0,09 | 0,41 | 2,42 |
| Dummy_Mixed | 0,29 | 0,11 | 0,46 | 2,71 | 0,02 | 0,05 | 0,53 | 0,73 | 1,38 |
| Total number of cleats | 0,14 | 0,03 | 0,79 | 4,02 | 0,01 | 0,06 | 0,21 | 0,54 | 1,87 |
| Hardness | 0,04 | 0,01 | 0,71 | 3,65 | 0,01 | 0,02 | 0,07 | 0,55 | 1,81 |
| Total Average Diameter (mm) | 0,05 | 0,01 | 0,77 | 4,53 | 0,00 | 0,02 | 0,07 | 0,71 | 1,41 |
| Force/Area Nm/cm² | 0,00 | 0,00 | 0,15 | 0,74 | 0,48 | -0,01 | 0,01 | 0,52 | 1,92 |
| Material | 0,44 | 0,22 | 0,36 | 2,05 | 0,07 | -0,05 | 0,93 | 0,68 | 1,48 |
Analysis for FG classification:
Maximum torque value
One of the objectives of this thesis was to characterize the behavior of the leading soccer cleats on the market from the perspective of rotational resistance. For this, an ANOVA was conducted to first understand whether there is any difference in terms of the commercial classification of the cleats, which are most commonly divided into FG, HG, SG, and TF, and later to investigate whether the stud design also has an influence, beyond the characteristics of the cleats themselves. In this sense, the ANOVA results revealed that the classification of the cleats has an effect on the maximum torque value, which was statistically significant (F = 7.479; p = 0.001), indicating that the type of cleat classification directly influences the maximum torque generated during use. The Bonferroni post-hoc analysis revealed that TF (turf shoes) cleats produced significantly lower torque compared to FG (firm ground) and HG (hard ground) cleats. The average observed difference compared to FG cleats was 10.2 Nm (p = 0.001), and compared to HG cleats, the difference was 8.2 Nm (p = 0.006). These results suggest that TF cleats, used on artificial or synthetic grass surfaces, tend to generate less torque, possibly due to their stud architecture, which is typically designed for 2nd and 3rd generation artificial turf fields and, consequently, have shorter and less spaced studs, which could reduce friction with the ground. Literature indicates that cleats with more and smaller studs, such as TF cleats, provide less traction, which can be advantageous on artificial surfaces that do not require deep stud penetration to generate traction. Wannop [18] suggests that cleats for synthetic grass require less stud depth to avoid knee overload, corroborating our findings of lower torque in TF shoes. In contrast, SG cleats are designed for softer surfaces, where wet soil allows greater stud penetration, increasing torque. As observed, SG cleats showed higher torque than TF shoes, although with low significance (p = 0.057), suggesting that on softer, more uneven surfaces, such as waterlogged fields, SG cleats may indeed provide greater traction and, consequently, more torque. This is supported by studies indicating that softer surfaces require footwear with greater stud penetration capacity to generate adequate traction. On the other hand, the analysis of the effect of stud design type (circular, pyramidal/rectangular, and mixed) did not show statistical significance (F = 0.229, p = 0.796). This suggests that the stud design itself is not a determining factor in maximum torque generation, corroborating previous findings in the literature, where the shape of the studs has less impact on overall traction compared to their quantity, material, and distribution.
Multiple linear regression: When analyzing the multiple linear regression model that includes all the independent variables, we observed that the model was statistically significant, explaining 65.2% of the variation in maximum torque (R² = 0.652, p < 0.001). Among the most relevant predictors, the classification of SG boots (Standardized Beta = 0.25, p = 0.023) and the type of material (Standardized Beta = 0.56, p = 0.005) stood out, both showing significant effects in increasing the maximum torque. This result suggests that the choice of SG boots, which are typically designed for soft and wet surfaces, tends to maximize torque due to the increased traction they provide. Similarly, a more flexible or softer material also contributes to an increase in rotational traction.
Another important factor was the stud diameter, which also showed a positive relationship with torque (Standardized Beta = 0.37, p = 0.004). Increasing the stud diameter seems to increase maximum torque, possibly because of the larger contact area between the studs and the ground, which can increase resistance to slipping during rotational movements. These findings are consistent with studies indicating that larger studs better distribute forces during quick direction changes, thus increasing the generated torque. However, the increase in torque associated with larger studs, as reported by Wannop & Stefanyshyn [19,20], demonstrated that larger diameters can increase traction while simultaneously raising the risk of lower limb injuries due to the increased torque generated in rotational movements. For cleat rigidity, the torque behavior showed an inverse relationship (Standardized Beta = -0.40, p = 0.035), suggesting that stiffer cleats tend to reduce torque. This can be explained by the fact that greater rigidity may restrict sole deformation and, consequently, limit the penetration of the studs into the ground, decreasing traction. This result contradicts some expectations, as greater rigidity could provide more control and stability, but at the same time, it seems to compromise the flexibility needed to generate torque. This may be explained by the fact that stiffer cleats make it harder for the studs to penetrate the surface, thus reducing the torque generated. Previous studies, such as Henning & Sterzing [20], suggest that although stiffer cleats provide more support, they limit the player’s flexibility and may negatively affect traction, especially on harder surfaces.
Other variables, such as the total number of studs, average stud height, and hardness, were not statistically significant in the model (p > 0.05), suggesting that, although these variables may influence movement dynamics in other contexts, their impact on the maximum torque generated by the boots seems minimal. These results align with studies indicating that the interaction between the number of studs and torque is not as direct as one might assume, as it largely depends on the soil conditions and surface type.
Stratified models by design: The stratification of the regression models by stud design type (circular, pyramidal/rectangular, mixed) provided more clarity on the factors that affect the maximum torque in each configuration. For the circular stud design type, the multiple linear regression model explained 74.6% of the variation in maximum torque (adjusted R² = 0.746). This finding may be related to the fact that circular studs provide lower rotational resistance compared to rectangular or pyramidal studs, as reported by Lambson [5] in a study that investigated the impact of different stud shapes on the incidence of anterior cruciate ligament (ACL) injuries. For the pyramidal/rectangular model, 66.6% of the variation in maximum torque was explained by the included variables (adjusted R² = 0.666). The total number of studs (standardized Beta = 1.0, p = 0.02) was the most important predictor, suggesting that the more studs in a pyramidal design, the greater the generated torque. This result is supported by findings that the distribution of studs in a pyramidal/rectangular shape can increase the contact area, maximizing traction. When combined with a larger number of studs, this tends to optimize the torque. Literature has also pointed out that additional studs better distribute pressure and improve traction, especially on firmer terrains, such as hard or synthetic fields.
For mixed design cleats, the model showed that 74% of the variation in maximum torque could be explained by the predictor variables (adjusted R² = 0.743). The most important predictors were hardness (standardized Beta = 1.67, p = 0.01) and stud diameter (standardized Beta = 0.86, p = 0.04), suggesting that in mixed design cleats, these characteristics significantly influence the generated torque. These results suggest that the material and stud design are key determinants in the performance of these cleats. The findings indicate that the type of cleat, material, and stud diameter are key factors in determining the maximum torque generated during use. SG cleats and more flexible materials seem to favor an increase in torque, while higher rigidity reduces this ability. The variability in generated torque also depends on the classification and design of the studs, with cleats featuring pyramidal/rectangular studs and a higher number of studs showing greater torque potential. The results emphasize the importance of considering ground conditions and stud design to optimize performance and reduce the risk of injuries.
Rigidity
Multiple linear regression model considering all measures: According to Field [17], the value of R indicates the correlation between the predictor variables and the dependent variable. In this model, R = 0.642 indicates a moderate positive correlation between the predictors and rotational rigidity. In terms of explained variability, R² = 0.412 suggests that 41.2% of the variability in rigidity can be explained by the independent variables in the model. However, the adjusted R² of 0.271 indicates a significant reduction when adjusting the model for the number of variables, implying that part of the variance might be overestimated by the included variables, suggesting a less robust relationship when the model is adjusted for the number of predictors.
The model’s significance was confirmed with a value of (F = 2.926; p = 0.005), according to the ANOVA, validating that the inclusion of predictors has a statistically significant effect on rigidity. Therefore, the independent variables, when included together, affect the dependent variable in a relevant manner. The value of the Durbin-Watson test = 2.00 indicates the absence of autocorrelation of the residuals, satisfying one of the assumptions of linear regression [17,21]. This value close to 2 suggests that the residuals are independent of each other, eliminating the possibility of sequential patterns among the residuals that could affect the accuracy of the model.
Analyzing the standardized regression coefficients (Beta) to understand the magnitude and direction of the influence of each variable in the model, some variables stand out:
Dummy_Material showed the highest standardized Beta coefficient (0.50) and a p - value of 0.03, indicating that the material type of the soccer shoe has a significant impact on rigidity. According to Pestana and Gageiro [20], a high Beta coefficient suggests an important contribution from the variable to the model, standing out compared to the other predictors. Additionally, the VIF of 3.62 is within the acceptable limit, suggesting low multicollinearity between Dummy_Material and the other variables, reinforcing the independence of this variable as a predictor of rigidity.
Dummy_Mixed was also significant (Beta = 0.28, p = 0.05) with a VIF of 1.48, indicating the absence of significant collinearity. According to the classification suggested by Field [17], this variable shows a moderate and independent influence on rotational rigidity, suggesting that the mixed stud design contributes to the variability in rigidity independently.
Contact Area per Stud (cm2) showed an inverse effect (Beta = -0.65, p = 0.01) and was one of the most influential variables in the model. This negative coefficient indicates that a smaller contact area increases rigidity. In this sense, there is an increase in force in the outsoles of shoes with studs that have a smaller contact area. Although the VIF of 11.33 indicates high multicollinearity, Pestana and Gageiro [21] explain that, in cases where the variable plays a key role, it can be kept in the model as long as its effect on the overall fit of the model is positive, as is the case here.
Other variables included in the model, such as Dummy_Circular and Force/Area Ratio, did not show statistical significance and are not discussed here.
Stratified model by design type: In the stratified analysis by shoe design type, the results show that only the model considering the circular design presented statistical significance. For the models of the other types, pyramidal and mixed, there was no significance, which indicates that these models were not able to consistently explain the variability in rotational rigidity of shoes with these designs. This lack of significance may be related to factors such as the sample size, which may have limited the ability to detect significant effects, or even to the specific characteristics of these designs, which, within the context of the analyzed data, did not seem to influence rigidity.
For the circular design, the model presented an R² value = 0.660, indicating that 66% of the variation in rigidity is explained by the independent variables, while the adjusted R² = 0.423 shows a reduction when considering the number of predictors, suggesting that the model explains approximately 42% of the variation when adjusting for the number of independent variables. This adjusted R² value can be considered moderate [17], suggesting some explanatory effect of the model, but with variability in rigidity that was not captured by the variables included in the model. The Durbin-Watson value of 2.45 indicates that the residuals do not show significant autocorrelation, meeting the residual independence requirements as indicated by Field (2013). Field and Pestana; Gajeiro [17] discuss that a value close to 2.0 is ideal, as it shows that the residuals are independent from each other, which is an essential factor for the validity of the regression model.
In the ANOVA analysis of the circular model, we have a residual sum of squares of 0.301 and a mean residual sum of squares of 0.03, indicating that the residual error is small relative to the sum of squares explained by the regression. The F - value = 2.77 with a p - value = 0.04 suggests that the independent variables, taken together, have a statistically significant effect on rigidity, confirming the adequacy of the model for this specific shoe design. In relation to the other analyses and variables, no statistically significant differences were found. However, some interesting average values were observed, suggesting a potential influence of these measures.
Stratified model by classification: In the rotational rigidity analysis stratified by classification, we observed that the models that showed statistical significance were for the FG and TF classifications. The HG and SG classifications did not show statistical significance, with SG being excluded due to the low number of samples, which limits its ability to provide results for the analysis.
For the FG shoe model, the value of R = 0.902 suggests a substantial correlation between the independent variables and rigidity, with R² = 0.814 indicating that approximately 81.4% of the variation in rigidity can be explained by the predictors included in the mode Tabela 14. This high value indicates that the selected independent variables provide a consistent and significant explanation for rigidity in FG shoes. When adjusted for the number of predictors, the adjusted R² drops to 0.670, indicating that even after the adjustment, the model still maintains a robust predictive capacity Table 13. This adjustment is important, as the adjusted R² value accounts for the potential loss of explained variance when including multiple variables, thus reducing the risk of overfitting [17]. The Durbin-Watson test value of 2.26 confirms the absence of significant autocorrelation among the residuals. This lack of autocorrelation is a key requirement, as it confirms the suitability of the linear regression model by ensuring that the residuals are not correlated with each other, which could distort the coefficients and accuracy of the analysis [17].
The analysis of variance (ANOVA) confirms the statistical validity of the model (F = 5.638; p = 0.01), indicating that the inclusion of the independent variables significantly affects the dependent variable. The residual sum of squares of 0.266 and the mean residual sum of squares of 0.03 show that the residual error is relatively small compared to the variance explained, reinforcing the accuracy of the model in capturing variations in rigidity.
Among the standardized regression coefficients, some stand out for their statistical relevance and impact on the rigidity of FG shoes. The Total Number of Studs variable had a standardized Beta coefficient of 0.79 (p = 0.01), indicating a strong positive relationship with rigidity. This result suggests that an increase in the number of studs is associated with a substantial increase in rigidity, which can be explained by the larger contact area that prevents excessive rotation. According to Pestana and Gageiro [21], interpreting high Beta coefficients is crucial for determining which variables have the greatest impact, reinforcing the importance of this variable in the current model. The VIF value of 1.87 for this variable shows that there is no significant collinearity, indicating that its contribution to the model is independent and not redundant.
The D Shore A Hardness variable also had a significant impact, with a standardized Beta of 0.71 (p = 0.01), suggesting that the hardness of the sole and studs contributes positively to rigidity. This coefficient indicates that the harder the stud, the higher the rotational rigidity, which aligns with the literature linking material hardness to resistance to rotational movement. The VIF of 1.81 confirms the independence of this variable in the model. Meanwhile, the Average Total Stud Diameter variable had a Beta coefficient of 0.77 (p = 0.01), also highly significant, showing that an increase in stud diameter tends to increase rotational rigidity, validating the inclusion of these measures in the model.
The Material predictor had a standardized Beta of 0.36 with no statistical significance (p = 0.07), suggesting a trend that the material type impacts the rigidity of the shoes. This result suggests that there may be unexplained variability by this variable. Field [17] emphasizes that variables with low or no significance can still be considered relevant in exploratory studies, as their statistical significance may be more related to sample size than to the variable’s effect.
Other variables, such as Dummy Circular and Force/Area Ratio Nm/cm², were not statistically significant, with p > 0.05, indicating that within the analysis of rigidity for FG shoes, these variables have low explanatory contribution to the model. Furthermore, most of these variables did not meet the requirements for multiple linear regression.
Application of the results: From the perspective of applying the results, rotational rigidity is a representative measure of the resistance a soccer shoe offers to rotational movement, that is, the force required to change each degree of rotation. This is a more specific metric, different from the maximum torque value, and it occurs at the initial moments of the movement. It is important in relation to the biomechanics of direction change movements. Gehring [22] and Oliveira WR, et al. [23] emphasize that the initial moments of rotational contact represent a crucial period for controlling the forces that influence movement stability. During these initial moments, high rotational rigidity can hinder the body’s response to load and reaction to rotational movement, thus increasing stress on the knee and ankle joints. Specifically in field sports, such as soccer, where rapid direction changes and rotational movements are constant, understanding rotational resistance to rotational movement is essential to ensure that the soccer shoe provides sufficient stability without compromising the athlete’s safety. Pioneering studies, such as Lambson et al. [5], paved the way for recognizing rotational rigidity as an important measure in determining the risk factor for anterior cruciate ligament (ACL) injuries. This study indicated that shoes with excessive or insufficient rotational rigidity could increase the risk of injuries, as high rotational forces are transferred to the knee joint when the shoe does not slide adequately on the ground. In sports like rugby, high rotational rigidity can stabilize the athlete’s position, but at the same time, it may restrict the foot’s necessary rotation, resulting in torque loads that overload the knee joint. Biomechanics applied to injury prevention in sports suggests that moderate rigidity is essential: it must be enough to provide traction and support, but not so high that it prevents the expected foot rotation during direction changes. The design of the cleats in soccer shoes directly affected rotational rigidity. Larger diameter studs, for example, increased the contact area and potentially the resistance to rotational movement. However, as shown by Villwock, et al. [24], if the studs are too rigid or made of a material that does not allow flexibility, the result will be an increase in rotational resistance, leading to higher torque forces exerted on the foot and leg. The same study also highlights that shoes with low rotational resistance, especially when used on hard turf, reduce the risk of non-contact injuries by allowing greater rotational freedom during quick direction changes, limiting overload on the lower joint structures.
In the context of soccer, Wannop, et al. (2010) showed that shoes designed with higher stiffness in the sole increase traction, but reduce ankle and knee mobility during forced rotations, which can be harmful in the long term, especially on natural grass surfaces. Furthermore, excessive resistance prevents foot rotation, transferring forces to the ligamentous structures of the knee, a factor recognized as predisposing to ACL injuries. In rugby and American football, sports that share this demand for frequent rotation, the shoe material and stud design are even more critical due to the higher incidence of impact and rotational force involved, indicating that the relationship between rigidity and injury is equally important and deserves attention in the development of sports footwear for these sports [25-27].
While the present study offers valuable insights into the biomechanical characteristics of soccer cleats and their influence on rotational resistance, several limitations should be acknowledged. These limitations, however, do not undermine the study’s relevance but rather highlight opportunities for future research and methodological improvements.
One of the primary limitations of this study is the use of a mechanical testing device to evaluate rotational resistance and stiffness rather than testing on human subjects. Although mechanical testing allows for controlled and reproducible conditions, it does not fully replicate the complex biomechanical interactions between the foot and the shoe during dynamic sports movements. However, this approach was chosen intentionally to isolate the effects of cleat design and material, minimizing confounding variables that would arise in human trials. Moreover, most studies on rotational resistance adopt mechanical testing protocols due to the inherent difficulty of measuring these forces accurately in live conditions. Thus, this study represents a crucial step toward understanding the mechanical behavior of soccer cleats, forming a solid basis for future human-based research.The study did not include a foot model to simulate the anatomical and biomechanical behavior of the foot within the cleat. The lack of a foot model could limit the ecological validity of the results, as the interaction between the foot, the shoe, and the playing surface is known to influence rotational resistance. Nevertheless, the study’s findings provide a controlled evaluation of cleat design features, which is valuable for identifying key variables that affect performance and injury risk. Future studies could benefit from incorporating a foot model to improve the realism of the testing conditions and enhance the applicability of the results to real-game scenarios.
Although the study analyzed 58 different cleat models, the sample size within specific cleat classifications (e.g., HG and SG) was relatively small, which may have limited the statistical power to detect certain effects. Additionally, variability in cleat design and material among different manufacturers may have introduced noise into the analysis. However, the sample was carefully selected to cover a wide range of commercially available cleats, ensuring that the results are representative of the current market. Expanding the sample size and including more models from different manufacturers in future studies could help refine the predictive capacity of the models.
Future studies could benefit from the inclusion of a foot model to simulate the anatomical and biomechanical behavior of the foot within the cleat during rotational movements. This adjustment would improve the ecological validity of the results, ensuring that the measured torque and stiffness values more accurately reflect real-game conditions.
While mechanical testing provides controlled conditions, future research should consider combining laboratory analysis with on-field assessments to capture the dynamic nature of player-shoe-surface interactions. This would provide a more comprehensive understanding of how cleat design features influence performance and injury risk during actual gameplay.
The study highlighted the potential link between cleat design and injury risk, particularly for non-contact injuries. Future research could explore this relationship in greater detail by conducting longitudinal studies that track injury incidence over time and correlate it with specific cleat characteristics.Given also the significant influence of material type and stud configuration on rotational resistance, future studies could investigate the effects of emerging materials and structural designs (e.g., 3D-printed studs, adaptive materials) on cleat performance and injury prevention.
This study provided a detailed characterization of the main physical characteristics of soccer shoes that can influence maximum torque and rotational rigidity, which are measured mechanically but provide crucial information about the interaction between the footwear and the surface. The multiple regression analysis revealed the application of different statistically significant models capable of explaining a substantial portion of the variation in these parameters, with emphasis on variables such as stud diameter, material type, and rigidity.
The findings related to maximum torque pointed to a positive influence of stud diameter and the material type used in the shoes. Larger studs and stiffer materials were associated with higher maximum torque values, while rigidity showed an inverse relationship, reducing the maximum torque values. These results suggest that stiffer shoes may minimize excessive rotational movements, which is relevant both for performance and injury prevention. The consistency of these findings with previous studies reinforces the importance of considering these variables in the design of sports footwear.
Regarding rotational rigidity, the stratification by design type indicated that circular studs were the only ones to present a statistically significant model, highlighting their potential role in influencing this variable. On the other hand, the classification analysis revealed that FG and TF shoes were the only ones to present consistent patterns, while HG and SG shoes showed more variable behaviors, possibly due to design differences or sample size limitations.
The results obtained in this study are broadly supported by the literature, which highlights rotational rigidity as a critical factor in preventing non-contact injuries. Moreover, the study provides a solid scientific basis to guide future interventions in shoe design. The identification of significant predictive variables, such as stud diameter and material type, offers valuable insights for optimizing footwear with the aim of improving cleats safety and performance.
Finally, this work significantly contributes to the advancement of knowledge in the field of biomechanics applied to sports footwear design, highlighting the importance of detailed and methodologically robust analyses in identifying characteristics that directly impact athlete performance and safety. These results enhance the understanding of the biomechanical factors influencing soccer shoe behavior and also offer practical guidance for developing footwear within the context of soccer.
Fundings
This work was supported by the FAPERGS under Grant number 19/2551-0001840-1.
Data availability
The data supporting the findings of this study are available within the article.
Authors contribution
WRO: conceptualization, methodology, writing, draft, data analysis; EW:data analysis, data collect; JFL: investigation, resources, writing - review, supervision, funding acquisition.
- Callister R, Chuter V, Hawes M, Hawke F, Peterson B, Sadler S, et al. Biomechanical and musculoskeletal measures as risk factors for running-related injury in non-elite runners: a systematic review and meta-analysis. J Sci Med Sport. 2021;24:S42. Available from: https://www.jsams.org/article/S1440-2440(21)00355-8/abstract
- Bermon S. Evolution of distance running shoes: performance, injuries, and rules. J Sports Med Phys Fitness. 2021;61(8):1073–80. Available from: https://doi.org/10.23736/s0022-4707.21.12728-8
- International Association of Athletics Federation (IAAF). Rules. Jakarta: PB PASI; 2007.
- Stuart MJ. Gridiron football injuries. In: Epidemiology of Pediatric Sports Injuries. 2005;49:62–85. Available from: https://doi.org/10.1159/000085392
- Lambson RB, Barnhill BS, Higgins RW. Football cleat design and its effect on anterior cruciate ligament injuries: A three-year prospective study. Am J Sports Med. 1996;24(2):155–9. Available from: https://doi.org/10.1177/036354659602400206
- O'Connor AM, James IT. Association of lower limb injury with boot cleat design and playing surface in elite soccer. Foot Ankle Clin. 2013;18(2):369–80. Available from: https://doi.org/10.1016/j.fcl.2013.02.012
- Hennig EM. The influence of soccer shoe design on player performance and injuries. Res Sports Med. 2011;19(3):186–201. Available from: https://doi.org/10.1080/15438627.2011.582823
- Butler RJ, Russell ME, Queen R. Effect of soccer footwear on landing mechanics. Scand J Med Sci Sports. 2014;24(1):129–35. Available from: https://doi.org/10.1111/j.1600-0838.2012.01468.x
- Queen RM, Charnock BL, Garrett WE Jr, Hardaker WM, Sims EL, Moorman CT 3rd. A comparison of cleat types during two football-specific tasks on FieldTurf. Br J Sports Med. 2008;42(4):278–84.
- Inklaar H. Soccer injuries. Sports Med. 1994;18(1):55–73. Available from: https://doi.org/10.2165/00007256-199418010-00006
- Ekstrand J, Hägglund M, Waldén M. Injury incidence and injury patterns in professional football: the UEFA injury study. Br J Sports Med. 2011;45(7):553–8. Available from: https://doi.org/10.1136/bjsm.2009.060582
- van Beijsterveldt AMC, Krist MR, Schmikli SL, Stubbe JH, de Wit GA, Inklaar H, et al. Effectiveness and cost-effectiveness of an injury prevention programme for adult male amateur soccer players: design of a cluster-randomised controlled trial. Inj Prev. 2011;17(1):e2–e2. Available from: https://research.vu.nl/en/publications/effectiveness-and-cost-effectiveness-of-an-injury-prevention-prog
- Bisesti BA, Lawrence MA, Koch AJ, Carlson LA. Comparison of knee moments and landing patterns during a lateral cutting maneuver: shod vs. barefoot. J Strength Cond Res. 2015;29(11):3075–8. Available from: https://doi.org/10.1519/jsc.0000000000001134
- Thomson A, Whiteley R, Bleakley C. Higher shoe-surface interaction is associated with doubling of lower extremity injury risk in football codes: a systematic review and meta-analysis. Br J Sports Med. 2015;49(19):1245–52. Available from: https://doi.org/10.1136/bjsports-2014-094478
- Silva DCF, Santos R, Vilas-Boas JP, Macedo R, Montes AM, Sousa ASP, et al. Influence of cleats-surface interaction on the performance and risk of injury in soccer: a systematic review. Appl Bionics Biomech. 2017;2017:1305479. Available from: https://doi.org/10.1155/2017/1305479
- Oliveira WR de. Proposal of an equipment to measure the resistance generated in the interaction of different soccer shoe soles with the contact surface. 2020. Available from: https://lume.ufrgs.br/bitstream/handle/10183/222926/001125943.pdf?sequence=1
- Field A. SPSS. Discovering statistics using SPSS. 2nd ed. Porto Alegre, RS: Artmed; 2009.
- Wannop JW, Stefanyshyn DJ. The effect of normal load, speed, and moisture on footwear traction. Footwear Sci. 2012;4(1):37–43. Available from: http://dx.doi.org/10.1080/19424280.2011.653992
- Stefanyshyn DJ, Wannop JW. Biomechanics research and sport equipment development. Footwear Sci. 2015;18(4):191–202. Available from: http://dx.doi.org/10.1007/s12283-015-0183-5
- Hennig EM, Sterzing T. The influence of soccer shoe design on playing performance: a series of biomechanical studies. Footwear Sci. 2010;2(1):3–11. Available from: http://dx.doi.org/10.1080/19424281003691999
- Pestana MH, Gageiro JN. Discovering regression: with the complementarity of SPSS. 2005. Available from: https://www.researchgate.net/publication/272820216_Descobrindo_a_Regressao_com_a_Complementaridade_do_SPSS
- Gehring D, Rott F, Stapelfeldt B, Gollhofer A. Effect of soccer shoe cleats on knee joint loads. Int J Sports Med. 2007;28(12):1030–4. Available from: https://doi.org/10.1055/s-2007-965000
- de Olivera WR, Onodera AN, La Torre M. Influence of cleat design on knee joint moments during cutting maneuver and instep kick in soccer. Muscles Ligaments Tendons J. 2019;9(3). Available from: https://www.mltj.online/wp-content/uploads/2019/09/Olivera.pdf
- Villwock MR, Meyer EG, Powell JW, Fouty AJ, Haut RC. Football playing surface and shoe design affect rotational traction. Am J Sports Med. 2009;37(3):518–25. Available from: https://doi.org/10.1177/0363546508328108
- Ballal MS, Usuelli FG, Montrasio UA, Molloy A, La Barbera L, Villa T, et al. Rotational and peak torque stiffness of rugby shoes. Foot (Edinb). 2014;24(3):107–10. Available from: https://doi.org/10.1016/j.foot.2014.06.006
- Wannop JW, Stefanyshyn DJ. The effect of translational and rotational traction on lower extremity joint loading. J Sports Sci. 2016;34(7):613–20. Available from: https://doi.org/10.1080/02640414.2015.1066023
- Wannop JW, Foreman T, Madden R, Stefanyshyn D. Influence of the composition of artificial turf on rotational traction and athlete biomechanics. J Sports Sci. 2019;37(16):1849–56. Available from: https://doi.org/10.1080/02640414.2019.1598923